

.png)


Frontline turnover is more expensive than you think
The true cost of losing a frontline worker goes well beyond recruiting and training. From overtime coverage to lost productivity, the hidden costs add up fast — and with average frontline turnover rates between 40% and 75%, most organizations are bleeding money they don’t even realize they’re losing.

Job postings, background checks, onboarding, uniforms, and training for every new hire.
New hires take 2-3 months to reach full productivity, and experienced workers pick up the slack.
When one person leaves, morale drops, workload increases, and more workers start looking elsewhere.
For a 500-person frontline workforce with 60% turnover, that’s roughly $1.4 million per year in turnover costs — and most of it is preventable.
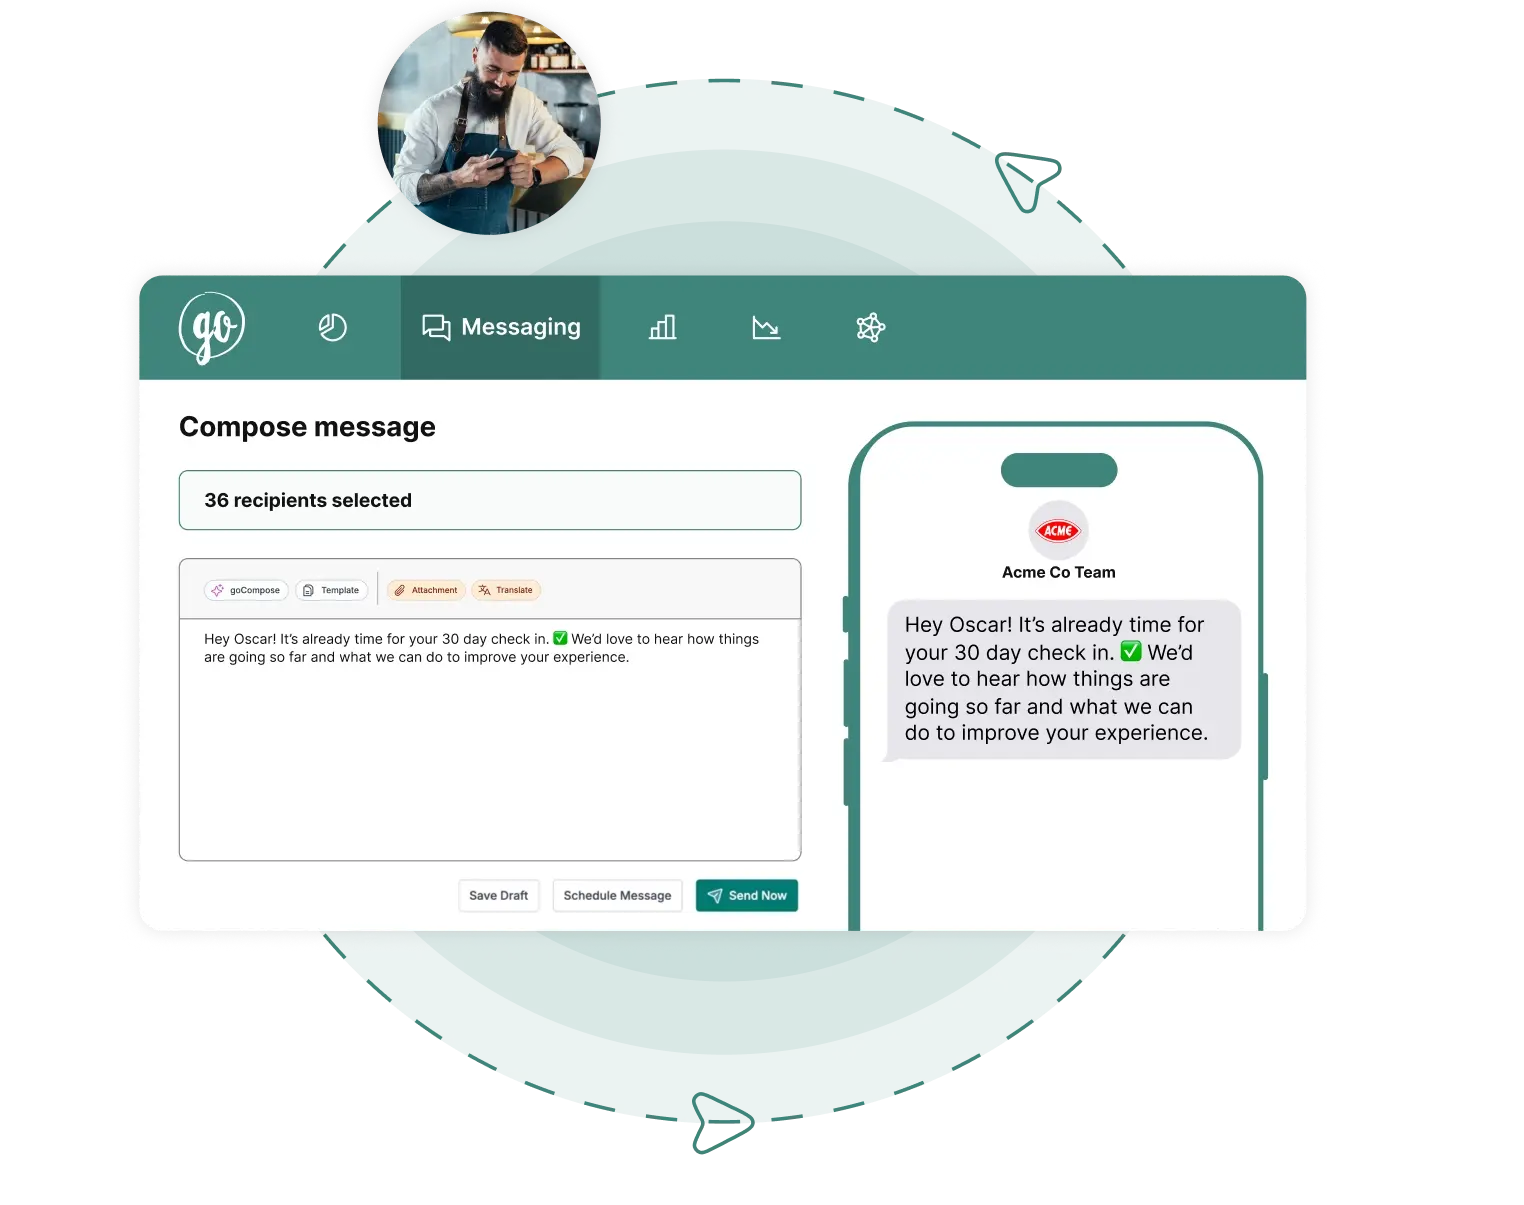
Direct, instant communication
SMS messages have a 98% open rate and are read within 3 minutes. Compare that to apps (less than 9% push notification interaction) or email (which most frontline workers do not have).
- ✓ 98% open rate for SMS vs. less than 9% for app push notifications
- ✓ Messages read within 3 minutes on average
- ✓ No app download or login required for workers
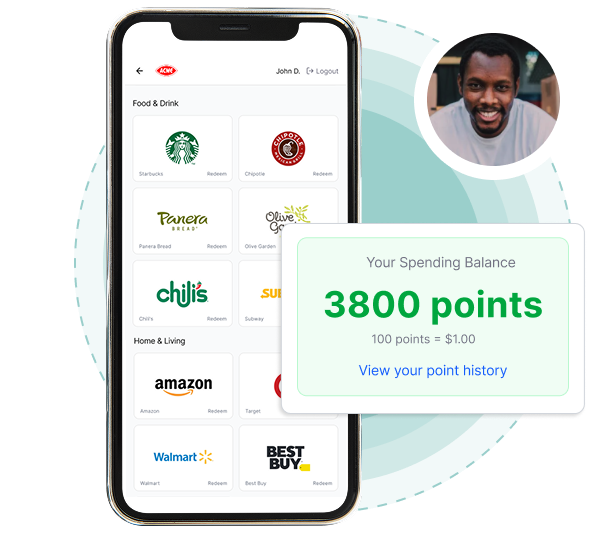
Consistent recognition at every location
Workers compare their recognition to what peers at other locations receive. Automated celebrations and peer shout-outs ensure every worker feels seen, regardless of location.
- ✓ Automated birthday and work anniversary celebrations
- ✓ Peer-to-peer shout-outs via text
- ✓ Consistent recognition experience across all locations
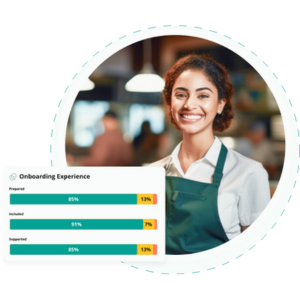
A real feedback loop
Text-based surveys get dramatically higher response rates than app-based or email alternatives because they meet workers where they already are. When workers see that their feedback leads to changes, they stay longer.
- ✓ 60%+ response rates vs. 10-15% for app-based surveys
- ✓ Anonymous feedback encourages honest responses
- ✓ Real-time sentiment tracking by location
Frictionless access to information
Benefits details, pay information, schedules, and company resources delivered via a texted link instead of an app or portal nobody checks. When workers can easily find what they need, frustration drops.
- ✓ Benefits, pay, and schedule info via text link
- ✓ No app or portal login required
- ✓ Reduces frustration and HR inquiry volume
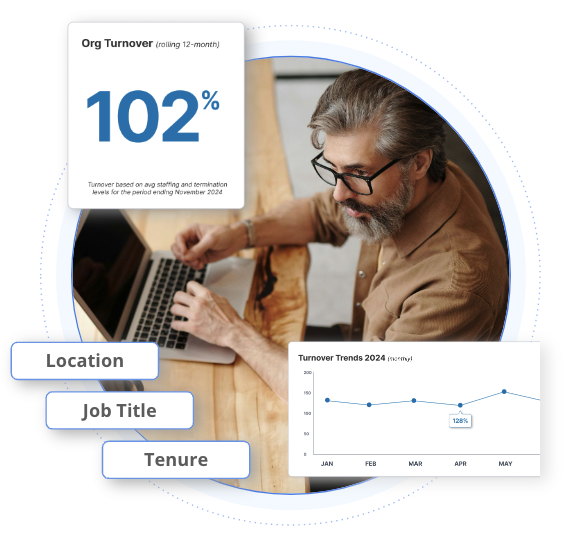
Data-driven retention strategy
Real-time turnover analytics with industry benchmarking help leaders understand where they stand and where to focus. Combined with engagement survey data, organizations can identify at-risk locations before turnover spikes.
- ✓ Real-time turnover analytics with industry benchmarking
- ✓ Engagement survey data identifies at-risk locations
- ✓ Predictive insights help prevent turnover spikes
Frontline ROI and engagement FAQ
The calculator uses real industry benchmarks from SHRM and Bureau of Labor Statistics, combined with actual turnover reduction data from goHappy customers. Default values are conservative — most goHappy customers see results at the higher end of the range.
14% is the conservative baseline from our customer data. Individual results range from 14% to 51% reduction in frontline turnover, depending on industry, starting turnover rate, and how fully the platform is adopted.
The default $4,700 per employee includes direct costs (job postings, background checks, onboarding, training, uniforms) and indirect costs (overtime coverage, lost productivity during ramp-up, manager time spent on hiring). Some estimates put the true all-in cost even higher.
Most goHappy customers see measurable engagement improvements within the first 30 days. Turnover reduction typically becomes statistically significant within 3-6 months, depending on the organization’s size and starting turnover rate.
Yes. The calculator scales linearly, and goHappy’s platform serves organizations from 100 to 50,000+ frontline workers. The per-employee savings are consistent regardless of size, though larger organizations often see additional efficiencies.
You can enter your own turnover rate and replacement cost manually. The industry dropdown is there for convenience — it pre-fills benchmarks, but you can override any value with your actual numbers.
goHappy is purpose-built for the frontline. Unlike app-based tools that require downloads and logins (and typically see less than 9% engagement), goHappy uses SMS — which has a 98% open rate and requires nothing from the worker except a phone number. No app, no login, no friction.