

.png)


BUILT BY EXPERTS
Data-driven and researched-backed
Our comprehensive Frontline Engagement Model quantifies just how engaged your employees are.
- Built alongside industry leaders, our research-backed platform complements our decades of frontline experience.
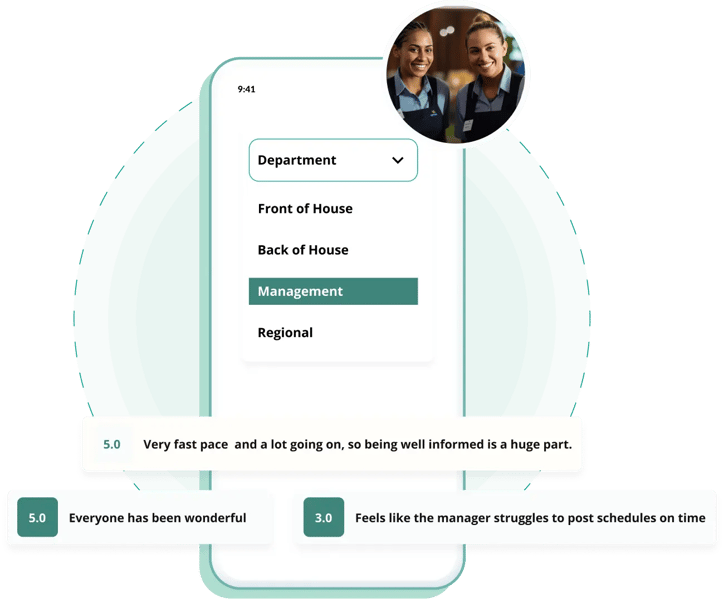
- Our survey results reveal how manager actions directly affect the employee experience, which in turn drives employee engagement.
- Our survey questions get to the heart of your employees' experience and produce actionable results designed to help managers improve.
FRONTLINE-FOCUSED
Designed for deskless workers
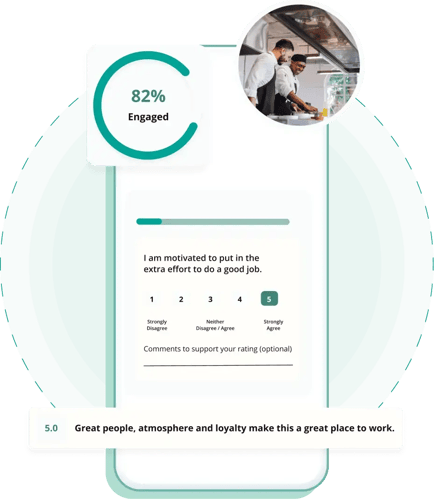
Built by experts for frontline employees, our mobile-friendly Employee Engagement Survey reflects industry best practices.
- Texts from goHappy have a 98% open rate and are usually read within just three minutes.
- Our proprietary surveys are responsive, reliable, and customizable.
- On average, employees finish the survey in less than three minutes — giving you instant feedback without wasted time.
- After creating a survey in any language, you can translate that survey into 115+ languages with just a single click.
ACTIONABLE AND IMPACTFUL
Reliable results and reporting
When your survey is complete, we’ll deliver personalized reports that can help you improve the employee experience for your frontline, including:
- A deep dive into our Frontline Employee Engagement Model
- A breakdown of all results with internal and external benchmarks
- Leader Guides packed with actionable tips for frontline management
- Detailed next steps for all parties based on survey responses


